State of Clipping Campaigns 2026: Data From 12,120 Posts
Original data from our own app's creator campaigns: rates, caps, views, rejections and earnings across 12,120 posts, with charts and methodology.
By Jacob Georgas · October 17, 2026

This is an original-data study of 12,120 pay-per-view creator posts across 7 campaigns for our own consumer app, DePuff AI, published from 2 July 2025 to 2 October 2026. It shows how rates, caps, views and creator earnings worked together in our program. These were mostly TikTok slideshow and talking-head posts, rather than clips cut from long videos. They use the payment model discussed in our clipping campaigns guide, but this is one advertiser, not a market census, and these are not Whop campaigns.
Key findings
- $0.40 per 1,000 views was the median recorded rate among posts with a positive rate.
- 5,111 views was the median post result.
- 65.5% of posts had under 10,000 views.
- 39.9% of posts were rejected, with low views the most common stated reason among those with a reason recorded.
- $339,331.88 was earned by creators across 7,079 approved posts.
- 68.4% of pay went to the top 10% of earning posts.
- $0.246 per 1,000 views was the real creator cost (total earnings divided by all views on earning posts), against a $0.40 median rate.
- 59 creators accumulated at least $1,000 in earnings over the study period.
- 3.5% was the median engagement rate (likes, comments and shares divided by views) on posts with 1,000+ views.
“Earnings” here means approved amounts on posts marked paid or finalized; some were not yet paid on the pull date. The advertiser pays creators; ViewsBase tracks posts and calculates what each creator is owed.
What rates and caps did these campaigns use?
The recorded rate and the per-post view cap describe different parts of a creator's offer. The rate prices eligible views. The cap limits the views used to calculate that post's view-based pay.
| Measure | 25th percentile | Median | 75th percentile |
|---|---|---|---|
| Rate per 1,000 views, among posts with a positive rate | $0.20 | $0.40 | $0.50 |
| Per-post view cap, among posts with a positive cap | 500,000 | 700,000 | 750,000 |
7.27% of all posts reached their per-post cap. That makes caps relevant even when most posts receive modest views. These are terms from our own program, not recommended market rates. See how rates and caps are applied before choosing terms for yours.
How are views distributed?
Most posts were small. A few reached a much larger audience. The median describes a typical post more usefully than a highlight reel of the biggest hits.
| Percentile | Views per post |
|---|---|
| 25th | 1,421 |
| Median | 5,111 |
| 75th | 23,798 |
| 90th | 236,283 |
| 99th | 2.10 million |
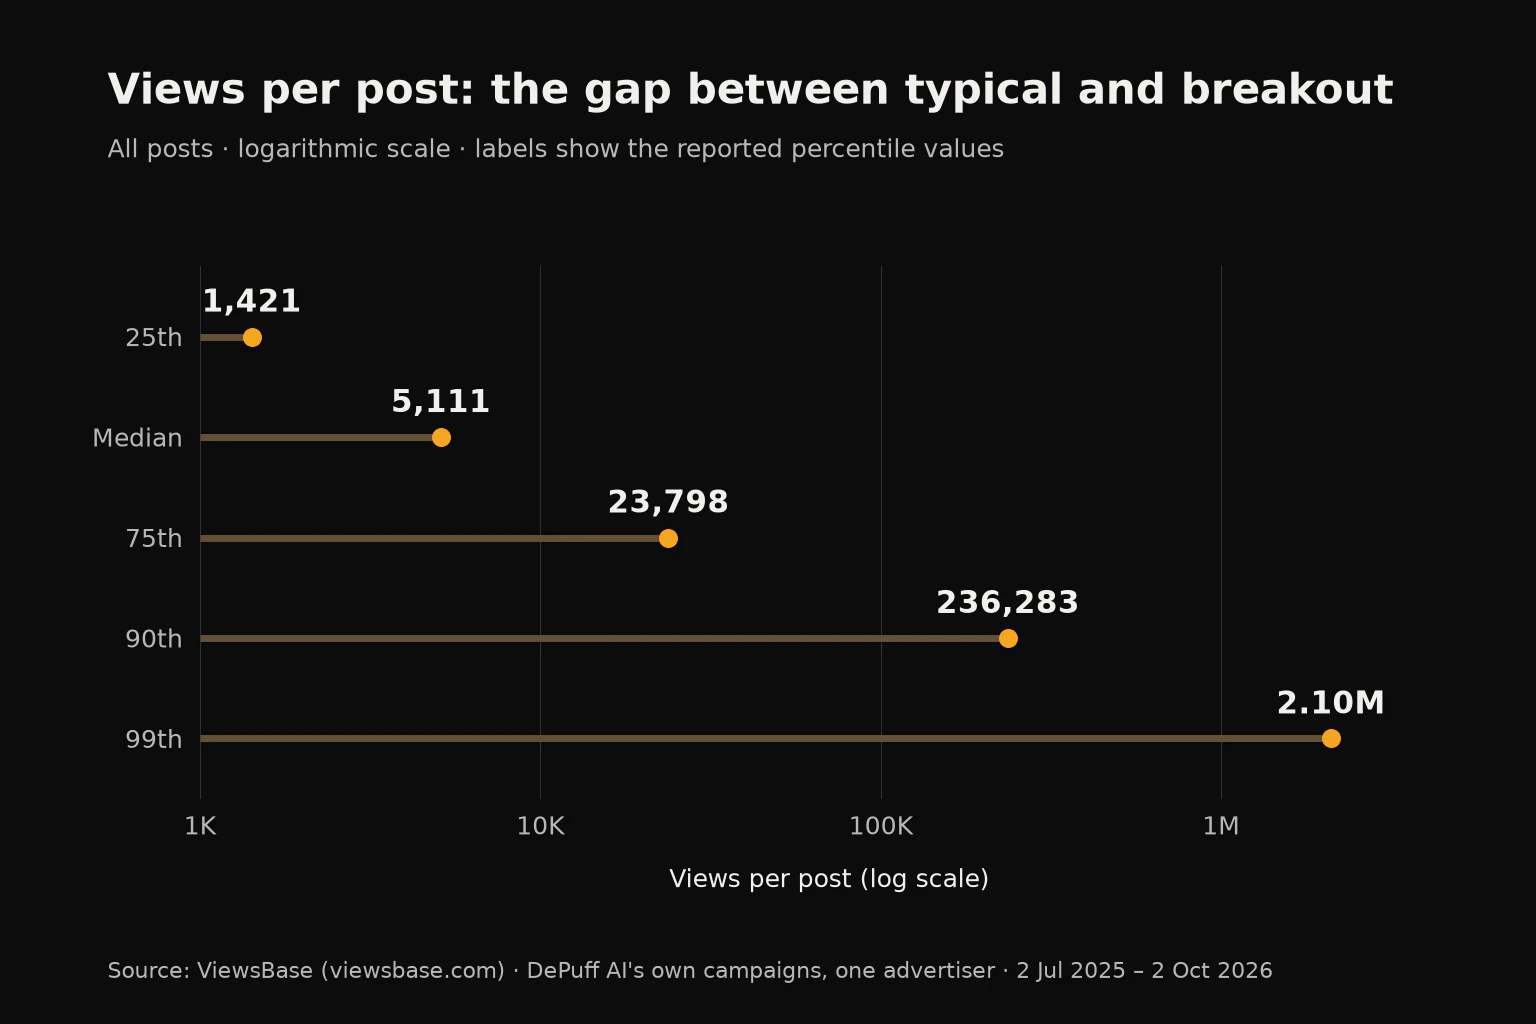
The horizontal axis is logarithmic: equal spacing means an equal multiplier, not an equal increase in views.
| Views per post | Share of all posts |
|---|---|
| Under 1,000 | 16.5% |
| 1,000 to under 10,000 | 49.0% |
| 10,000 to under 100,000 | 19.5% |
| 100,000 to under 1 million | 11.9% |
| 1 million or more | 3.1% |
On posts with 1,000+ views, the median engagement rate was 3.5%, measured as likes, comments and shares divided by views.
Plan for a spread of outcomes. This distribution does not tell you in advance which post will break out, or whether a high-view post will bring customers.
Where does the money go?
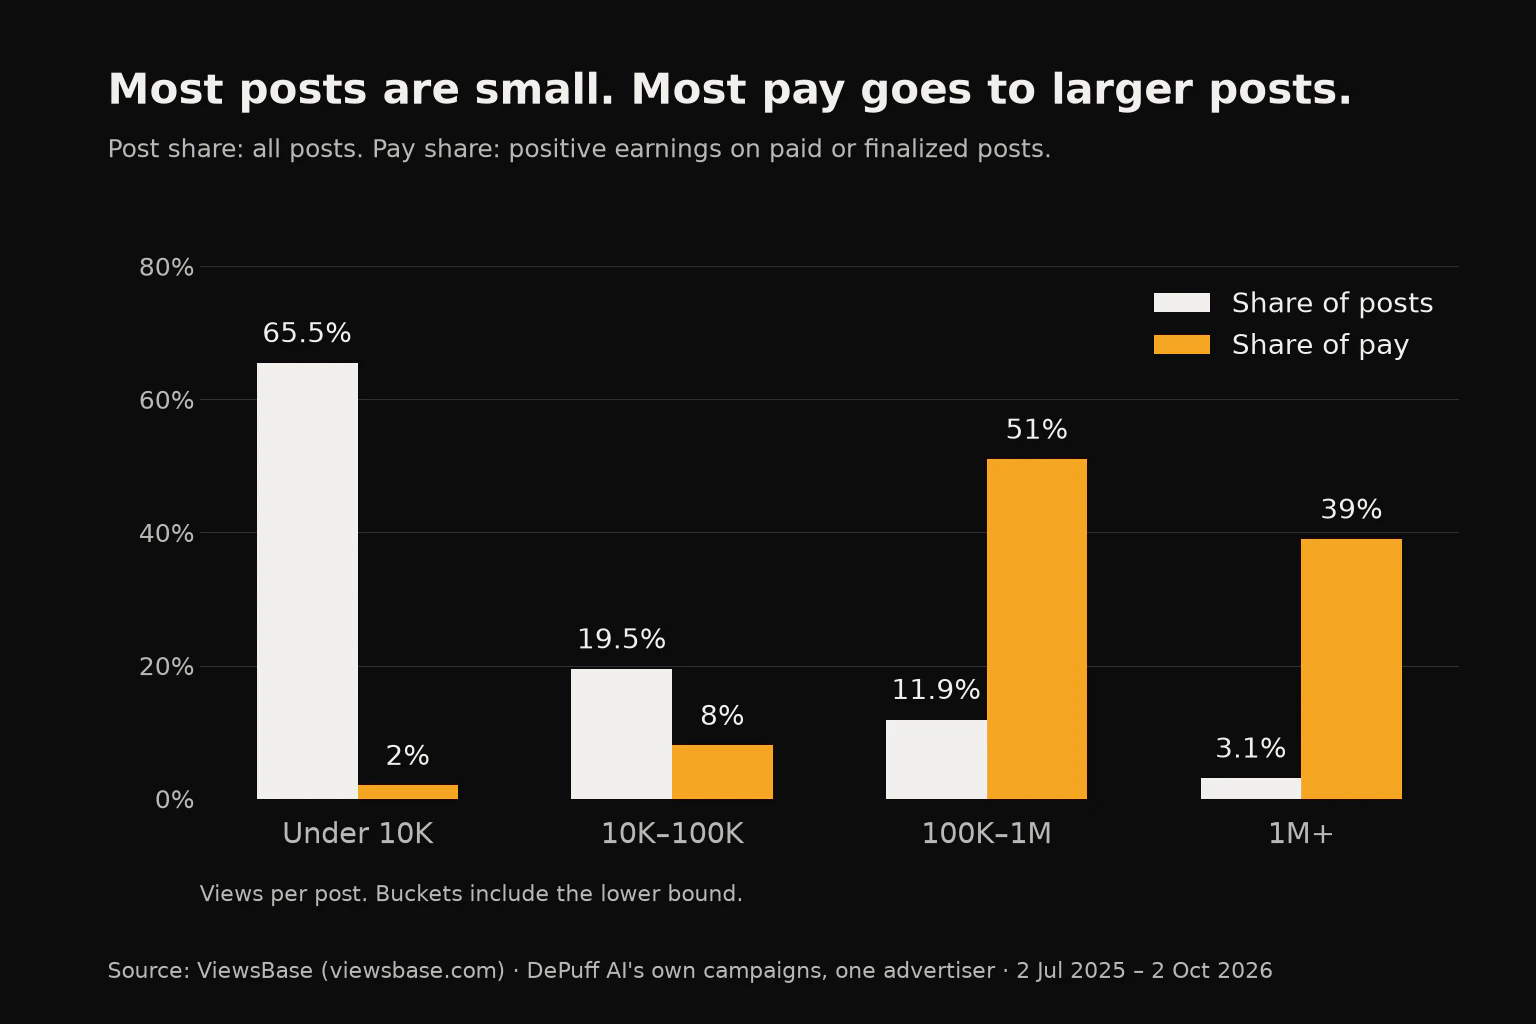
Pay was concentrated in posts with larger audiences. The chart compares each bucket's share of all posts with its share of earnings from earning posts. Those denominators differ.
| Views per post | Share of all posts | Share of pay |
|---|---|---|
| Under 10,000 | 65.5% | 2% |
| 10,000 to under 100,000 | 19.5% | 8% |
| 100,000 to under 1 million | 11.9% | 51% |
| 1 million or more | 3.1% | 39% |
Under 10,000 combines the under-1,000 (16.5%) and 1,000–10,000 (49.0%) buckets. Pay shares are rounded to whole percentages.
Ranked by earnings, the top 10% of earning posts received 68.4% of pay. The top 10% of earning creators received 71.6%. These are earnings rankings, separate from the view buckets above.
| Earnings per earning post | Amount |
|---|---|
| Median | $4.62 |
| 75th percentile | $31.01 |
| 90th percentile | $140 |
Why was real cost below the median rate?
The 7,079 earning posts had 1,377,396,331 views and $339,331.88 in earnings. Total earnings divided by those views, expressed per 1,000 views, gives $0.246.
Views beyond a cap add no pay, which lowers the real cost per view. The $0.40 median rate gives each rated post equal weight, while the pooled cost is weighted by views.
Rejected posts are left out of both totals, so they do not change the $0.246 figure. They are still work: 4,833 submissions (39.9%) needed a rejection decision.
How many posts were rejected, and why?
4,833 posts, or 39.9%, were rejected. Of those, 2,770 had no stated reason. Among the 2,063 with a recorded reason, 1,535 (74%) cited low views or not enough views. That share applies only to rejections with a stated reason.
| Common recorded rejection reason | Rejected posts |
|---|---|
| Low views / not enough views | 1,535 |
| Violates guidelines | 112 |
| Not related to project | 84 |
| Copyright | 30 |
| Deleted | 28 |
The other 274 rejections with a recorded reason are spread across smaller categories.
Separately, 1,951 rejected posts had under 1,000 views, or 40% of rejections. Because 2,770 rejections have no recorded reason, the reason shares above cover only part of the rejected group.
For an operator, the lesson is to make the minimum-view and content rules clear before posting, then record the reason when rejecting a submission. The post lifecycle documentation explains how counting and review fit together.
What did creators post and earn?
The dataset includes 391 creators, and 76.2% earned something under this study's earnings definition. Posting volume varied:
| Posts per creator over the study period | Posts |
|---|---|
| Median | 17 |
| 75th percentile | 34 |
| 90th percentile | 72 |
Among creators with positive earnings, the distribution was:
| Earnings per earning creator over the study period | Amount |
|---|---|
| 25th percentile | $24.58 |
| Median | $215.88 |
| 75th percentile | $803.45 |
| 90th percentile | $2,253.66 |
59 creators earned at least $1,000 in total. These are cumulative amounts across the study period, not monthly income or pay for a standard amount of work. Creators who earned nothing (23.8%) are not in this table.
How did posting volume grow by quarter?
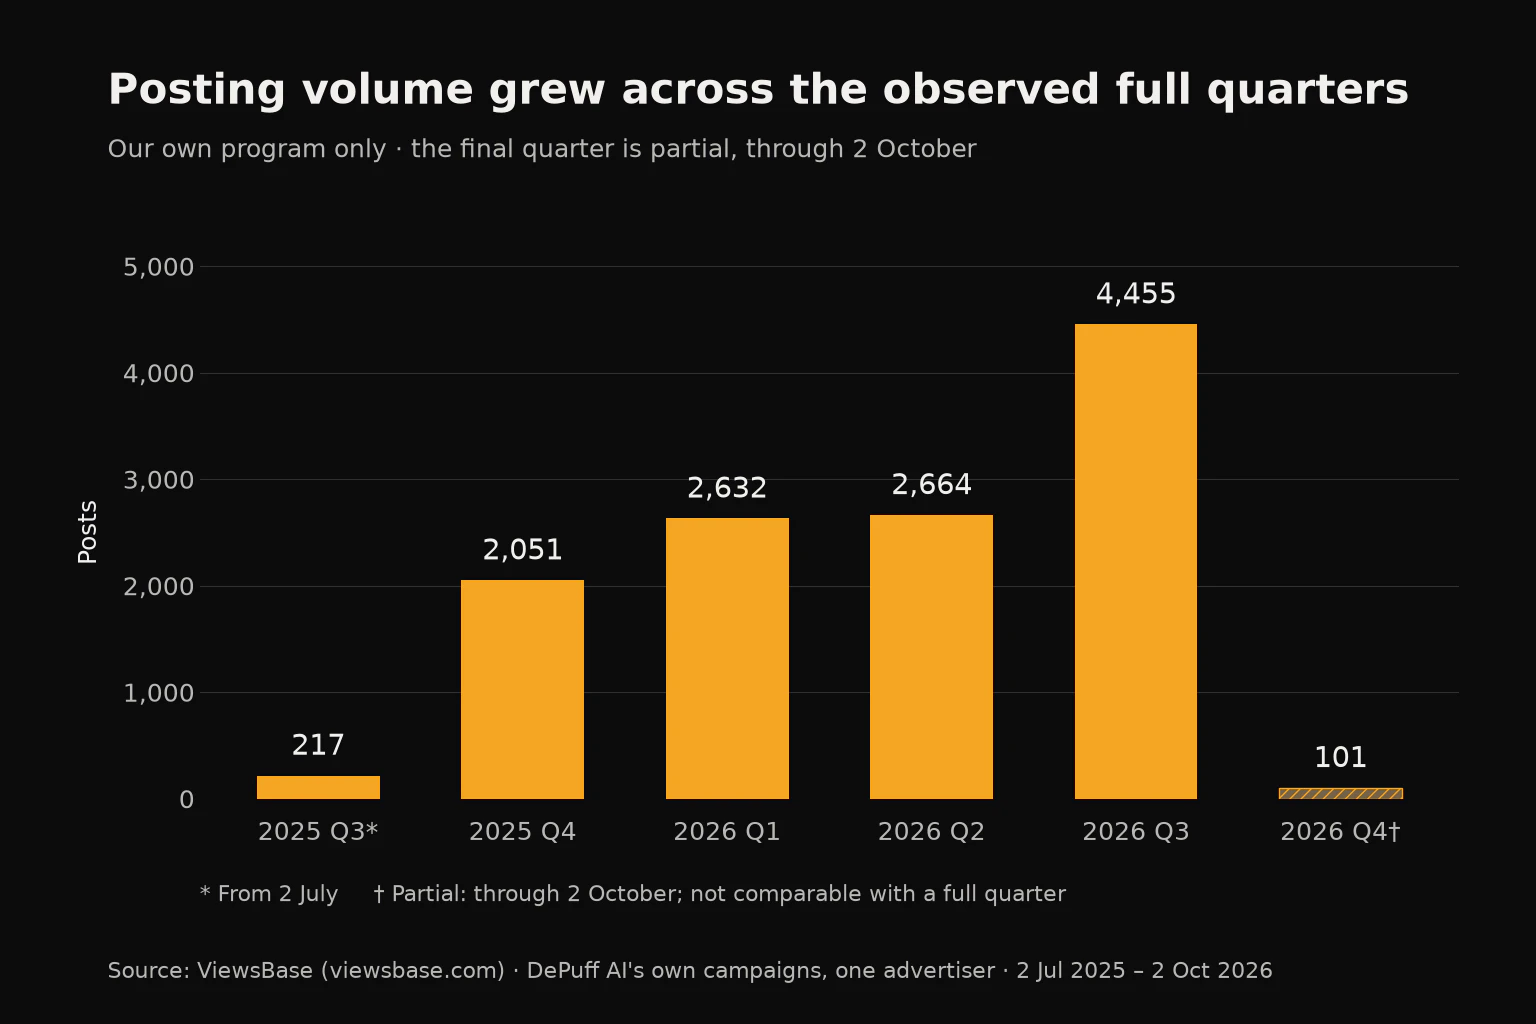
Posting volume rose across the observed full quarters. That describes the growth of our program, not the growth of the clipping market.
| Quarter | Posts |
|---|---|
| 2025 Q3, from 2 July | 217 |
| 2025 Q4 | 2,051 |
| 2026 Q1 | 2,632 |
| 2026 Q2 | 2,664 |
| 2026 Q3 | 4,455 |
| 2026 Q4, partial through 2 October | 101 |
The final bar covers only the start of the quarter. It is not evidence of a fall in posting activity.
What does this mean if you run a campaign?
- Set a maximum obligation before launch. Choose a rate and cap together, and document how they apply in each creator's payment terms.
- Budget for uneven results. Use the distribution of ordinary posts as well as your hits when planning a clipping campaign.
- Write rejection rules before creators post. State the minimum views, content requirements and counting window, then keep a reason for each decision in your review workflow.
- Ask agencies for distributions and denominators. A pooled creator cost is not an all-in agency price; the clipping agency guide explains how to compare scopes and quotes.
- Separate operating tools from campaign outcomes. Compare marketplace and own-program workflows, and include tracking software, review time and payment costs in your budget.
ViewsBase tracks views, applies rates and caps, and calculates creator amounts. Your team reviews the records and pays creators with its own payment method.
Methodology
Source and scope. We used a read-only aggregate query of the ViewsBase production database, pulled on 17 October 2026. Only the workspace for our own consumer app, DePuff AI, was included. Customer workspaces and demo campaigns were excluded. We publish aggregates only, with no creator identities or individual campaign results.
Dates and cutoff. Included posts were published from 2 July 2025 to 2 October 2026, before 3 October 2026 at 00:00 UTC. The cutoff leaves at least 14 days before the pull for view-counting windows to close. 71 posts (0.6%) were still pending at the pull.
Sample sizes. The full sample is 12,120 posts, 7 campaigns and 391 creators. It contains 11,716 TikTok posts (96.7%) and 404 Instagram posts (3.3%). Views distributions and rejection shares use the full post sample. Earnings calculations use 7,079 posts with positive finalized amounts. Creator earnings percentiles cover the 76.2% of creators with positive earnings. Rate and cap percentiles cover posts with a recorded rate or cap above zero.
Views and earnings. Views use the finalized view count when present, otherwise the current recorded count. Earnings include a post only when its status is paid or finalized and its finalized_amount is greater than zero. A stored amount on a rejected or other excluded post does not count. Finalized earnings can still be unpaid. The advertiser sends payments; ViewsBase records and calculates amounts.
Calculation notes. We use continuous percentiles for post rates, caps, views and earnings, and earnings-ranked deciles for the top-share figures. The real cost divides earnings by all recorded views on earning posts, including views beyond caps, then expresses that ratio per 1,000 views. It excludes software, payment fees and labor. The median engagement rate is 3.5%, calculated as (likes + comments + shares) divided by views, only for posts with 1,000+ views. Percentages are shown at the precision of the query output, except the pending share, rounded to one decimal place. The combined under-10,000 post share adds the two lower-bucket shares; the non-earning creator share is the complement of the earning share.
Limitations. This is one advertiser in a consumer app niche, mostly using TikTok slideshows and talking-head posts. It is not a random sample, a market census, an agency benchmark or a study of Whop campaigns. We have not measured causal lift, acquisition cost or return on investment here. Differences in creators, content, audience and campaign terms limit comparisons with other programs. Missing rejection reasons also limit interpretation.
Cite this data
Suggested citation: ViewsBase, “State of Clipping Campaigns 2026: data from 12,120 posts in DePuff AI's own creator campaigns (one advertiser)”, https://viewsbase.com/blog/state-of-clipping-campaigns-2026, data pulled 17 October 2026.
You may reuse the charts with a link to this page. Please retain the source footer and the one-advertiser scope, and describe earnings as positive finalized amounts rather than confirmed cash payments.